Systems move to equilibrium because that is the point at which the reaction mixture has the lowest free energy. The free energy depends both on the compounds (what are the reactants and products) as well as the concentrations of the mixture. We can think of this as breaking down into two parts.
\[\Delta G_{\rm r} = \Delta G_{\rm r}^{\circ} + RT\ln Q\]
where this is the instantaneous difference in free energy between reactants and products at any given set of concentrations. This \(\Delta G_{\rm r}\) depends on two terms. The first is the standard free energy difference. This is the one we calculate from all of our tabulated data. It is a comparison between pure products (in their standard state 1 atm or 1M) and pure reactants (in their standard state 1 atm or 1 M). So if \(\Delta G_{\rm r}^{\circ}\) is negative, the products are lower in free energy and if it is positive, then reactants are lower. However, the point of the very lowest free energy is always somewhere in between these two. This is because some mixing always lowers the free energy (increased mixing leads to higher entropy leading to lower free energy). So the equilibrium point is always somewhere in between these two extremes. The more negative the standard free energy the closer the point will be towards all products, the more positive it is the closer this point is towards all reactants.
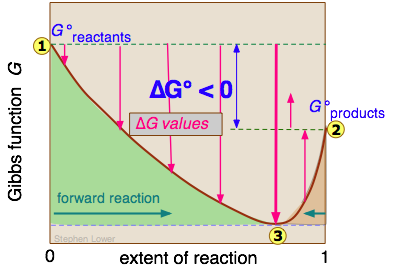
For example this diagram shows a reaction for which \(\Delta G_{\rm r}^{\circ}\) is negative so it "favors" the products.
This is a plot of the Gibbs free energy (labeled as the Gibbs Function) versus the extent of the reaction. When the extent of the reaction is zero, the mixture is 100% reactant molecules. When the extent of the reaction is one, the mixture is 100% product molecules. Point 1 on the graph is the Gibbs Free energy of the reactant molecules in their standard states and point 2 is the free energy of the products in the their standard state. The difference between these two is \(\Delta G_{\rm r}^{\circ}\). Since the products are lower in free energy, we know the equilibrium will lie towards the products. The minimum in free energy is the equilibrium point labeled 3. The larger \(\Delta G_{\rm r}^{\circ}\) is, the closer this point will be toward the reaction going to all products. Conversely if \(\Delta G_{\rm r}^{\circ}\) is positive the equilibrium will be on the reactant side as shown below.
For both of these plots, all of the various mixtures that lie between points 1 and 3 are reactant heavy (where \(Q\lt K\)) and the reaction will thus proceed forward, making more products. This allows the system to continue to decrease the overall free energy of the system until equilibrium is reached at the bottom of the "free energy well". Conversely, all of the mixtures that lie between points 3 and 2 are product heavy (where \(Q\gt K\)). All of those mixtures will therefore react by going backwards (to the left) which allows the free energy to drop back to the minimum state at the equilibrium position which is always at the bottom of the "well".
© 2013 mccord/vandenbout/labrake