Critical Point
The other "special" point on the phase diagram is the critical point.
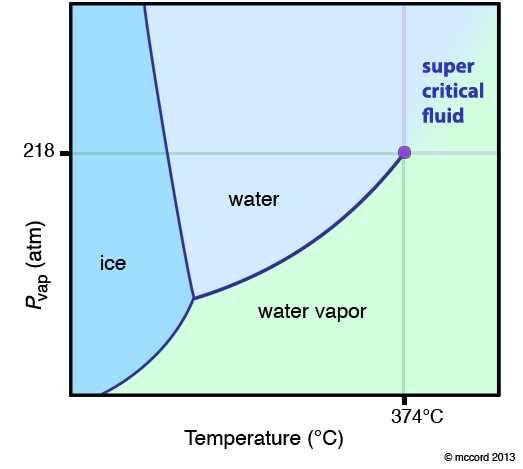
If you follow the vaporization curve up to high temperature and pressure, you notice it simply stops. This is not because the person who made the diagram was lazy. It is because this is the critical point for the substance (the purple dot in the diagram below). At temperatures and pressures greater than this point, the definition of a liquid and a gas disappear and the substance exists as a super-critical fluid (SCF). What is a super-critical fluid? It is a fluid (it takes the shape of its container) like a liquid and a gas, but it has a density that can vary between the two extremes of the liquid and the gas. This makes SCF extremely interesting. Typically, the molecules are either very close together or very far apart. In a SCF, they can essentially be anywhere in between.
What happens when you go from a gas to a SCF? Essentially nothing. That is, the boundary between the liquid and the SCF and the gas and the SCF is an imaginary line defined by the critical point. This is not a phase transtion. I repeat. Going from a gas to a SCF or a liquid to a SCF is not a phase transition. Going from a liquid to a gas, there is a discrete change in enthalpy, entropy, volume, density… This is a phase transition. When you “cross the line” from a gas to an SCF, there are no discrete changes. It is a continuous change. Thus, if the diagram shows this boundary, it is usually marked with dotted lines to note it is different.
Note: It is fairly easy to make CO2 a SCF (relatively low temperature and pressure). As a result, it has wide industrial use as a SCF solvent.