
Physical equilibria deal with the equilibrium phenomena that does not involve any chemical change. These are instead physical changes like phase changes or solubility. This section will look at both phase changes of pure substances as well as those of mixtures.
There are number of graphical means to help understand the relationships between the different phases of a particular substance. The first thing we need to do when looking at the transitions to different phases is to establish some definitions.
There are three particular phases between which we will be examining discrete phase changes. These are solids, liquids, and gases. Each transition has a particular name. We can view them graphically below along with the sign for the changes in enthalpy and entropy associated with each.
For example, the transition from liquid to gas is called vaporization. Vaporization is endothermic (uphill in energy), and this transition leads to an increase in entropy. The reverse transition of a gas going to a liquid is condensation. Since condensation is simply the reverse of vaporization, the changes in enthalpy and entropy will be exactly the same, but opposite in sign. So \(\Delta H_{\rm condensation} = -\Delta H_{\rm vaporization}\). Typically, you will only find tabulated values for the endothermic transitions. It would be redundant to list values for the exothermic transitions.
Which of the following transitions is exothermic?
One key component of thermodynamics of phase changes are the changes in energy (or enthalpy) of the system. These are straight forward to understand as attractive interactions between moleucles lowers their enthalpy. The enthalpy of two molecules in close proximity is lower than two molecules separated by some distance. This is the idea of intermolecules forces (IMF). IMFs are attractive in nature. This means the energy is lower when the molecules are together compared to when they are apart. From this we can see that the lowest enthalpy phase will be the solid phase and the highest will be the gas phase. The stronger the IMFs the larger the enthalpy changes between phases. Below is a video on understanding the Enthalpy change for Phase Transitions.
Enthalpy of Phase ChangesEnergy isn't everything. There is also the entropy. The entropy tells us about the number of potential microstates for distributing the energy. The higher the entropy, the more likely such a state is to randomly occur. This leads to the propensity for molecules to wander off to explore the edges of the universe. Solids have the fewest equivalent microstates while gases have the highest number. Thus solids are low in entropy and gases are high in entropy. While nature moves to lower energy it simultaneously is moving to higher entropy. Here is a video to help you understand Entropy changes for Various Phase changes. Learn to recognize when entropy increases and when it decreases.
Entropy of Phase ChangesIn the end what matters most is the free energy. This is our combination of enthalpy (energy) and entropy. Entropy is leading to everything wandering away all over the universe. Energy (via IMFs) is trying to hold everything together. The balance between enthalpy and entropy is controlled by the temperature. At low temperatures enthalpy dominates; thus most substances at low temperature are solids (lowest enthalpy). At high temperatures entropy dominates; thus most substances at high temperature are gases (highest entropy). Free energy is this combination of enthalpy and entropy. At any given temperature the most stable phase is the substance with the lowest free energy. Here is a video on understanding the Free Energy change for a given process and what influences it. Spontaneous changes always lead to a lower overall free energy.
Free Energy of Phase ChangesFinally, we can look at the equilibrium points between phases. At what temperature is the free energy of two phase the same so that they can co-exist. This is the point at which the enthalpy change and the temperature times the entropy change are equal. Here's a video on Calculating Transition Temperatures using ΔH and ΔS. Remember, at equilibrium, ΔG = ΔH - TΔS = 0. This then means that ΔH = TΔS when you are at equilibrium.
Phase Change TemperaturesLet’s take a deeper look at the thermodynamics. In particular, we can examine the relationship between the enthalpy and the temperature during phase transitions.
Remember, heat can be tricky. When there is no chemistry or phase transitions, then energy flowing into a system in the form of heat will lead to a temperature change. However, when there is chemistry or a phase transition, then energy will flow in and the temperature can stay constant. Why doesn’t the temperature go up? This is because the energy coming in results in higher potential energy and not higher kinetic energy. What is the higher potential energy in this case? It is the new state formed after the breaking up the IMFs between the molecules. Liquid water at 0 °C has a higher potential energy (enthalpy) than the same amount of ice at 0 °C.
This can be easily seen in a heating curve that plots the temperature of a system as a function of the heat flow into the system. Initially the system is a solid, then it has a melting transition, then it is a liquid, then has a vaporization transition, and then it is a gas. This is shown in the heating curve below for water. Initially, the system is solid water. As the heat flows in, the temperature of the ice increases.

The slope of this line is inversely related to the heat capacity of solid water (ice). Since this is at constant pressure \(q = \Delta H = mC\Delta T\). For those who have forgotten, q is the heat, m is the mass, C is the specific heat capacity, and \(\Delta T\) the change in the temperature. As this graph is a plot of T vs q, the slope is actually 1/mC.
As the heating continues, the solid melts. During this time the temperature is constant. The length of the line is the amount of heat required to melt the solid. This amount of heat is the enthalpy of fusion (\(\Delta H_{\rm fus}\)). \(\Delta H_{\rm fus}\) usually has units of kJ mol-1, thus the actual length of line will be n \(\Delta H_{\rm fus}\) since you’ll need to multiply by the number of moles of solid to get the total heat of the phase transition.
After all the solid melts, the temperature will then start to increase again. The slope of this line is again inversely related to the heat capacity. However, this time it is the heat capacity of the liquid (water). Once the boiling point is reached, the temperature will again be constant thoughout the vaporization transition. After all the liquid vaporizes, the temperature will increase again and the slope of the line will be inversely related to the heat capacity of the gas.
The diagram you mostly find associated with different phases of a substance is the so-called “phase diagram”. This diagram shows the regions of stability of different phases as a function of temperature and pressure. The interfaces between these regions will be the phase transition lines.
The phase diagram for CO2 is shown below.

Things to notice on the diagram.
1. Given a pressure and a temperature you can find the stable phase (gas, solid, or liquid)
2. As pressure and temperature are varied CO2 behaves as expected:
The key to a phase diagram is the phase transition lines. For example, in the lower left portion of the diagram is the sublimation line that divides the solid and the gas. At the interface between the solid and the liquid is the melting line. When interpreting a phase diagram, it is critical to note that the pressure that is important for the gas is the partial pressure of the substance you are looking at. Thus, it is best to think about the pressure in this graph as the pressure of CO2. This is very important as it means that the sublimation line and the vaporization line actually are the vapor pressure of the solid and the liquid. Later we will examine the mathematical relation that determines the temperature dependence of the vapor pressure.
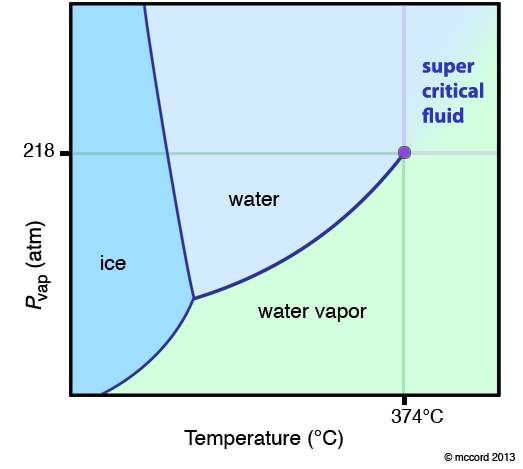
Below is another phase diagram, for water. Note how the solid/liquid line (ice/water line) has a negative slope. This means that you can melt ice by applying a higher pressure. Most substances (like CO2 above) have a positive solid/liquid line.

Interpreting Phase Diagrams.
In the above diagram for water what is the most stable phase at a temperature of 250K and a pressure of 100 bar?
One very special point on a phase diagram is the triple point. This is the temperature and pressure at which three phases are in equilibrium. Typically, when we are talking about a triple point it is the solid, liquid, gas triple point. For CO2 this is at a pressure of 5.11 atm and -56.4 °C. Many substances have more than one solid phase, and therefore they can have more than one triple point.
The other "special" point on the phase diagram is the critical point.
If you follow the vaporization curve up to high temperature and pressure, you notice it simply stops. This is not because the person who made the diagram was lazy. It is because this is the critical point for the substance (the purple dot in the diagram below). At temperatures and pressures greater than this point, the definition of a liquid and a gas disappear and the substance exists as a super-critical fluid (SCF). What is a super-critical fluid? It is a fluid (it takes the shape of its container) like a liquid and a gas, but it has a density that can vary between the two extremes of the liquid and the gas. This makes SCF extremely interesting. Typically, the molecules are either very close together or very far apart. In a SCF, they can essentially be anywhere in between.
What happens when you go from a gas to a SCF? Essentially nothing. That is, the boundary between the liquid and the SCF and the gas and the SCF is an imaginary line defined by the critical point. This is not a phase transtion. I repeat. Going from a gas to a SCF or a liquid to a SCF is not a phase transition. Going from a liquid to a gas, there is a discrete change in enthalpy, entropy, volume, density… This is a phase transition. When you “cross the line” from a gas to an SCF, there are no discrete changes. It is a continuous change. Thus, if the diagram shows this boundary, it is usually marked with dotted lines to note it is different.
Note: It is fairly easy to make CO2 a SCF (relatively low temperature and pressure). As a result, it has wide industrial use as a SCF solvent.
Definition of the vapor pressure: The partial pressure of a substance in equilibrium with its condensed phase (liquid or solid). The pressure of the vapor over a liquid (solid) at equilibrium.
We discussed vapor pressure and/or boiling point in CH301 as it related to intermolecular forces (IMF). Boiling point and vapor pressure are two sides of the same coin. The boiling point is the temperature at which the vapor pressure equals the total pressure. When comparing vapor pressures we need to be making comparisons at the same temperature. Thus at room temperature, the substance with the lowest boiling point will have the highest vapor pressure (easiest to get into the gas phase). The substance with the highest boiling point will have the lowest vapor pressure.
Vapor pressure is a liquid property related to evaporation. In the liquid (or any substance) the molecules have a distribution of kinetic energies related to the temperature of the system. Because this is a distribution there will always be a few molecules that have enough kinetic energy to over come the attractive potential energy of the other molecules (the intermolecular force), and escape the liquid into the gas phase. In an open container, these molecules will wander off (diffuse) into the room and out into the atmosphere. Eventually all the liquid will evaporate.
In a closed container, the molecules that evaporate will diffuse around in the gas phase, but eventually some of them collide with the liquid. The kinetic energy of the gas molecules has the same distribution as the liquid because they are the same temperature. So now many of the molecules that collide with the liquid will not have sufficient kinetic energy to overcome the IMF and they will "stick" to the liquid. Therefore in a closed container, molecules are both evaporating (turning into gas) and condensing (turning into liquid). The rate of evaporation depends on the temperature and the IMF. The rate of condensation depends on the temperature, the IMF, and the concentration in the gas phase. The condensation rate will initially be zero since there are no molecules in the gas phase. As the evaporation continues the concentration of the molecules in the gas phase (or partial pressure) will increase. This will cause the rate of condensation to increase. When the rate of condensation is equal to the rate of evaporation, the system will no longer change and you'll have a fixed concentration in the gas phase. This concentration can be characterized as a partial pressure. That partial pressure is the "vapor pressure" (VP) of the liquid. The vapor pressure for any pure liquid then depends only on the temperature and the IMF. As temperature increases, VP increases. The stronger the IMF between the molecules, the more energy is required to overcome them and enter the gas phase. Thus the rate of evaporation will be lower and the VP will be lower. Conversely weaker IMF will lead to higher VP.
VP and boiling point (BP) are also related as the boiling point is the temperature at which the VP is equal to 1 atm. Thus the trend in BP with IMF is related to the trend of VP with IMF. High IMF = difficult to "get into" the gas phase. This equates to low VP (few molecules in the gas phase) and high boiling point (high temperature to get the VP = 1 atm).
For example compare three liquids: water, ethanol (C2H5OH), and diethyl ether (C2H5)2O. They have room temperature vapor pressures of 24 Torr, 65 Torr, and 545 Torr respectively. This is the trend we expect from the IMFs. Water is polar and has strong H-‐bonds, ethanol is also polar but it has weaker H-‐bonds (only one H that can H-‐bond vs. the two that water has), and finally diethyl ether is the weakest as it has no H-‐bonds (no hydrogens bonded to the oxygen). We would expect diethyl ether to have the lowest boiling point (36.6 °C); ethanol to be next highest (78.4 °C); and finally water to exhibit the highest boiling point (100 °C).
Vapor Pressure MovieWe will see that we can relate any equilibrium concept back to the idea of free energy.
The stability of any given state is given by its free energy. At constant temperature and pressure, we utilize the Gibb’s Free Energy Equation
where \(G\) is the free energy, \(H\) is the enthalpy, \(T\) is the temperature, and \(S\) is the entropy. The lower the free energy, the more stable the state. Thus, lower enthalpy is more stable and higher entropy is more stable at a given \(T\).
What is the effect of the enthalpy?
For phases we have a competition. Intermolecular forces lead to attractions between the molecules. This means the molecules have a lower enthalpy (energy) when they are close together. This favors the solid state. In contrast, from an entropy standpoint, the higher the entropy the lower the free energy. This favors the gas phase as it has the highest entropy. The favored state then depends on the temperature. When the temperature is low, the energy dominates and substances are solid. When the temperature is high, the entropy dominates and substances are gaseous. The exact temperature of a phase change depends on the substance (and its intermolecular forces).
What is the effect of entropy?
The highest entropy state for any substance at a given temperature would be if the atoms/molecules were scattered out as far as possible. Thus from an entropy standpoint, everything should be a gas exploring the far reaches of the universe. However, all substances have intermolecular forces (interatomic forces) (IMFs) that lead to attractions between the molecules (dipole-dipole forces, dispersion forces, etc.). This means that they have a lower energy when they are close together as compared to far apart. Thus, the IMFs are “holding” the molecules close together. The stronger these forces are, the more difficult it is for the molecules to wander away from each other. Conversely, the lower the IMFs, the easier ’the wandering’ is. However, no matter the magnitude of the IMFs, there can always be a few molecules that escape. The number of these molecules and thus the partial pressure of the substance varies with the IMFs. Thus at a given temperature, if the IMFs are strong, the vapor pressure is low as only a few molecules can overcome the attractions of the molecules for each other. In contrast, a liquid with weak IMFs will have many molecules in the gas phase and thus a higher vapor pressure.
In closed container, the vapor molecules have the ability to condense back into the liquid. Once the rate of condensation is equal to the rate of evaporation, the system is at equilibrium and the concentration (partial pressure) of molecules in the gas phase will be fixed. The partial pressure of the substance at this point is the vapor pressure. At this partial pressure, the liquid has the same free energy as the vapor.. If we increase the temperature, we have to increase the pressure of the vapor to stay at equilibrium (same free energy).
How does the vapor pressure change with temperature? We would expect it to get larger as the temperature is raised. Why? As T increases we start to favor the higher entropy state. That is the gas phase. Let’s look at some data to see what happens to the vapor pressure of water as the temperature changes.

This figure shows the vapor pressure of water, ethanol, and diethyl ether as a function of temperature. Note the exponential function of temperature. The strongest IMF in water leads to the lowest vapor pressure at each temperature.
Using our ideas of free energy, we can develop an equation that quantifies this temperature dependence. Again we are using our "thinking like a chemist" approach to try to relate macroscopic measurable quantities (the vapor pressure and temperature) to microscopic molecular ideas (the free energy).
What are we looking at? A liquid in equilibrium with its vapor at a pressure P at a temperature T. When the system is at equilibrium the two phases have the same free energy. Thus we can say at this temperature and pressure
\[\Delta G_{\rm vap}=G_{\rm gas} -G_{\rm liq} = 0\]
The free energy of the liquid is approximately independent of the pressure, thus the free energy at pressure \(P\) is about the same as that at the standard pressure (the one with the zero superscript). Thus we get
\[G_{\rm liq} = G_{\rm liq}^\circ\]
However, the free energy of a gas depends strongly on the pressure (as do essentially all the properties of a gas). The free energy of a gas is given by the following relation
\[G_{\rm gas}(P) = G^\circ_{\rm gas} + RT\ln \left({P\over P^\circ}\right) = G^\circ_{\rm gas} + RT\ln (P)\]
where we drop the \(P^\circ\) term as long as we use \(P^\circ = 1\) atm. Then that ratio is just the value of \(P\) in atm. Putting this all together we find
\[\Delta G_{\rm vap} = G_{\rm gas}(P) - G^\circ_{\rm liq} = G^\circ_{\rm gas} + RT\ln (P) - G^\circ_{\rm liq}\]
\[0 = \Delta G^\circ_{\rm vap} + RT\ln (P)\]
\[\Delta G^\circ_{\rm vap} = -RT\ln (P) \]
Thus the vapor pressure depends on the standard free energy of vaporization.
\[\Delta G^\circ_{\rm vap} =\Delta H^\circ_{\rm vap} -T\Delta S^\circ_{\rm vap}\]
rearranging these gives
\[\ln(P) = {-\Delta G^\circ_{\rm vap} \over RT} = {-\Delta H^\circ_{\rm vap} \over RT} +{\Delta S^\circ_{\rm vap} \over R}\]
If we take \(\Delta H^\circ_{\rm vap} and \Delta S^\circ_{\rm vap}\) to be independent of temperature, then the only temperature dependent term in this equation is the one with the enthalpy change. Thus we see that temperature dependence of the vapor pressure depends on the enthalpy of vaporization. Remember the enthalpy term is the energy term. This is the one which relates the difference in potential energy in the liquid state to the potential energy in the gas state and is essentially the IMFs.
Rearranging the last equation we get
\[ P = K e^{-\Delta H^\circ_{\rm vap} / RT}\]
K is the vapor pressure in the limit of infinite temperature. At finite temperature the vapor pressure is lower by an exponential factor of the ratio of the enthalpy of vaporization compared with R times the temperature.
The final conclusion! The vapor pressure increases dramatically with temperature.
Using the ideas from the temperature dependence of the vapor pressure we can make a new equation that relates the vapor pressure, \(P_1\), at one temperature, \(T_1\), to the vapor pressure, \(P_2\), at another temperature, \(T_2\), we find the following (after some algebra).
\[\ln \left({P_2\over P_1}\right) = {\Delta H_{\rm vap}\over R}\left({1\over T_1} - {1\over T_2}\right)\]
This is the Claussius‐Clapeyron Equation. There are many forms in which you might find this equation, however they are all equivalent.
Note: This also means that if you plot \(\ln(P)\) vs \(1/T\) the graph will be a straight line with a slope equal to \(\Delta H_{\rm vap}/ R \).
Derivation of the Claussius-Clapeyron equation assume that the vapor behaves as an ideal gas such that its molar free energy (chemical potential) is simply given as
\[G = G^{\circ} + RT\ln\left ( {P \over P^{\circ}} \right )\]